The ‘price’ of things is a crucial consideration for any investor. Every asset class can be cheap or expensive. Equities are no exception. What does it mean for equities to be ‘cheap’ or ‘expensive’? In this entry, we’ll review the PE ratio, a key metric on the relative value of equities.
From valuations to the PE ratio
What are valuations?
Valuations is jargon for the price, relative to value, of a financial asset. In the financial industry, people say that valuations are high when they perceive financial assets to be expensive relative to the value they provide.
Measuring valuations
How do you measure valuations? One of the most popular choices is the Price-to-Earnings (PE) ratio. As the name hints, it’s the share price of an equity product divided by its earnings per share (EPS). Expressed as an equation:
Price-to-Earnings ratio = Share price / EPS
The numerator – share price
The numerator of the PE ratio is quite simple. It’s the share price you can easily observe for any publicly listed company.
The denominator – EPS
The denominator of the PE ratio is a bit more complex. Earnings per share (EPS) is the net profit of a company divided by the total amount of common shares of that company. In plain terms, EPS is how much money a company makes in a given year per unit of its stock. The higher the EPS, the better.
A simple example
Assume a fictitious company FinCo had a net profit of $50m last year. Its shares trade publicly at $64 per share. FinCo has 18m shares outstanding. What can we say about FinCo and its valuations?
- The EPS of FinCo is $2.8 ($50m in profits over 18m shares)
- The PE ratio of FinCo is ~23 ($64 per share over an EPS of $2.8)
Observing valuations for different sectors
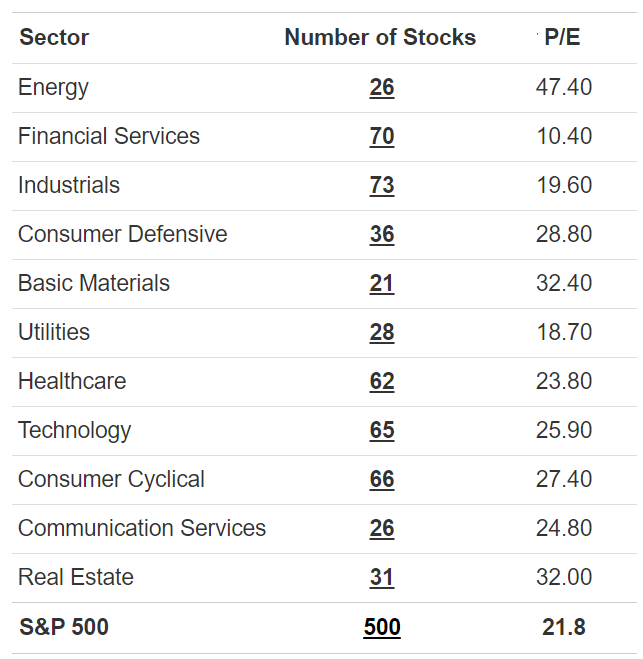
You can also calculate the PE ratio for groups of securities. You simply do a weighted average of the different ratios in the basket. We can use this to get a view of valuations of the S&P 500 by sector. This is useful to familiarize ourselves with typical valuation figures. The timestamp is end of May 2020.
Conceptualizing the Price-to-Earnings ratio
PE ratio and value of investments
We’ve seen that PE ratio = Share price / EPS. As an investor, you want low share prices and high EPS. Both things result in a low PE ratio. Low PE ratios indicate high value of investments. In other words, a unit of stock generates a lot of earnings relative to its price. The stock is cheap.
Conversely, high PE ratios are the result of either high share prices and /or low EPS. High PE ratios indicate low value of investments. A unit of stock is expensive relative to the value it provides. The stock is expensive.
Why is the PE ratio so useful?
At the time of writing, the price of a share of AMD is ~$50. A share of Amazon costs ~$2,400. Does this mean that Amazon is more expensive than AMD? Well, you clearly pay more for a single share of Amazon. But the price of a share doesn’t tell you whether something is expensive relative to its value. As we just saw, the PE ratio does.
The PE ratio is so useful because it’s a metric of relative valuation. It allows for an apples-to-apples comparison between the shares of different companies. At the time of writing, the PE ratio of AMD is ~120. That of Amazon is ~115. So Amazon is actually cheaper than AMD by a slight margin.
So low PE ratio = good, high PE ratio = bad?
No. Not necessarily, better said [1]. If you believe that financial markets incorporate all available information in the setting of prices – which is a reasonable hypothesis – then both low and high PE ratios must be somehow justified.
If a PE ratio is low, there’s probably reasons for it. Maybe the EPS of the company is expected to deteriorate in the near future.
Conversely, if a PE ratio is high, there’s also likely reasons for it. The case in point is tech companies. Over the past 20 years, valuations of tech companies have been sky high. The example on Amazon and AMD we just saw are illustrates this perfectly. A PE ratio of 100+ is very high. Just compare it with the average PE ratio of the different S&P 500 sectors. Or with any of these well-known, non-tech companies:
- Walmart: 24
- Visa: 35
- Caterpillar: 13
How come tech companies’ valuations are so high? Well, tech companies are generally speaking viewed as having higher growth potential than other sectors. Why? Because it’s easy for them to scale without increasing costs too much. It’s often the case that the market is factoring high levels of future growth in a tech company’s stock price (numerator). This high level of growth is still not present in the current EPS (denominator), though. The result is a high PE ratio.
Generally speaking, high PE ratios indicate that investors expect higher future earnings growth relative to lower ratios
Variations of the PE ratio
Everything we’ve seen up until now is the regular PE ratio, for which we use the last reported EPS for our calculations. Alternative calculations exist.
The forward PE ratio
The forward PE ratio is a variation that uses forecasted EPS (instead of last reported EPS) in the denominator [2]. It’s an attempt to incorporate future expectations into the EPS. This makes sense because the numerator of the ratio (i.e., the share price) surely includes future expectations, as we just discussed.
During periods of growth, forward PE ratios are lower than regular ratios. Why? Because you bake in higher future EPS.
The CAPE ratio
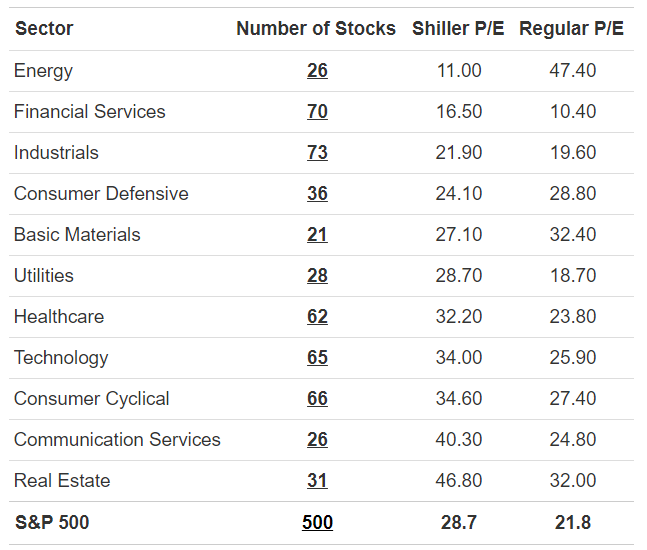
CAPE stands for Cyclically Adjusted PE ratio. An alternative name for it is Shiller PE ratio. It uses average EPS over a 10-year period to smooth out fluctuations that happen during a business cycle [3]. EPS for the different years are typically adjusted for inflation.
The main advantage of CAPE is that it’s less volatile than the regular or forward PE ratios. Promoters argue that it helps investors focus on the signal and ignore the noise.
Shiller PE ratios are considerable higher than regular PE ratios at the moment. This makes sense given how much EPS have increased in the US over the last decade.
Current and historical valuations
How do current equity valuations compare to historical data? Let’s find out.
Evolution of the PE ratio in the US
We’ll stick to the S&P 500 given that it represents ~55% of world equities [4, 5] and data is easily available. How has the PE ratio of the S&p 500 evolved over the last 40 years?
Data extracted from here
What we see on the chart:
- As of Jan 2020, the PE ratio was in the top ~25th percentile and the CAPE in the top ~15th percentile relative to the last 40 years
- Generally speaking, both PE and CAPE ratios have increased over the past 40 years
- The PE ratio spike in 2009 is due to the great financial crisis. EPS (denominator) decreased so much that the ratio skyrocketed
- The maximum CAPE occurred during the dot-com bubble, when valuations of tech companies were insanely high. Several tech companies were growing at 1,000%+ per year and the PE ratio of the Nasdaq 100 was over 200
Are high equity valuations justified?
Some people find it a bad idea to invest now because PE ratios are relatively high. We know that we shouldn’t time the market, but should we just ignore high valuations?
We’re entering subjective territory here. There’s no single truth as to whether the current high valuations are justified. Those who warn of high valuations as a sign not to invest often think we’re in a period of irrational exuberance. Others find current PE ratios justified given that:
- The relative weight of tech companies, for which higher valuations might be justified, has vastly increased over the past few decades. Today, 5 tech companies (Apple, Microsoft, Alphabet, Amazon and Facebook) make up 18%+ of the S&p 500 [6, 7]
- We are in a period of extremely low interest rates [8]. Interest rates are so low that equity valuations can go relatively high and still remain competitive option compared to bonds
I encourage you do to more research and form your own opinion.
What you’ve learned
Congrats on making it to the end. In this entry, you’ve learned:
- What is the Price-to-Earnings ratio
- How it’s useful and why both low and high figures are potentially justified
- What are different variations of the PE ratio (e.g. forward and CAPE)
- Why we’re in a period of relatively high equity valuations. And how this might or might not be justified
Last updated on May 31, 2020